Measuring the World

A seminar delving into the world of data and sensing through tools to document, measure and analyse daily analog and digital activities.

Mobirise Website Builder

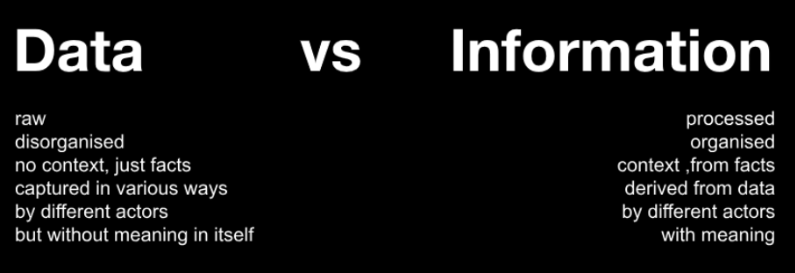
In the first session of the seminar, we explored the relationship between data and information, delving into ethical considerations and real-world examples. It highlighted the shift from raw data to meaningful information, touching on issues such as surveillance capitalism and how it leverages data to exert power and the impact of data on behavior. The session emphasized the importance of understanding the transformative power of data and the ethical implications of its collection and use.

Mobirise Website Builder

In session two, we expanded our discussion to include concepts like open data, software, and standards, emphasizing the role of design in shaping these aspects. We also considered the dynamics of trust regarding data ownership and data sharing, comparing our attitudes towards companies versus governments. Overall, these sessions provided a thought-provoking exploration of the complexities surrounding data, information, and their societal implications of a world that is increasingly seen through the lens of data, setting a solid foundation for further inquiry.

Project

Let's get physical

Mobirise Website Builder

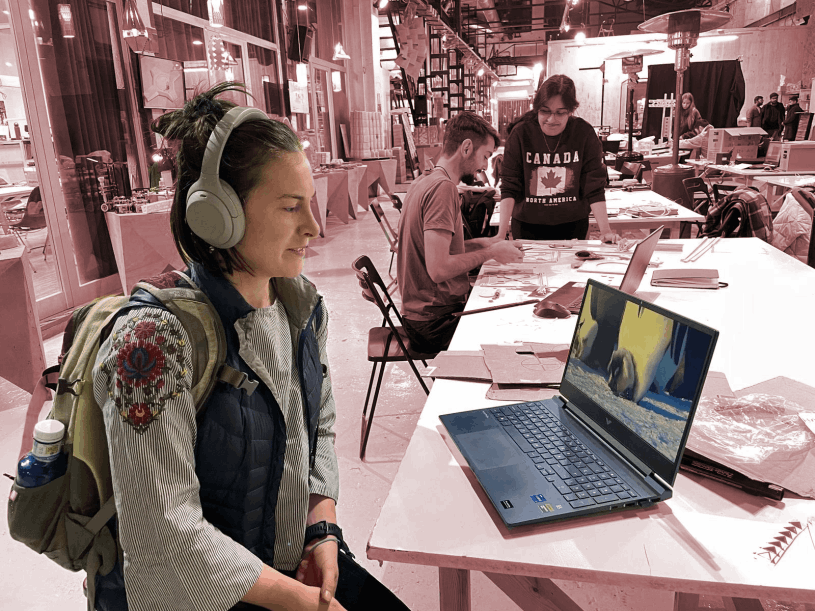
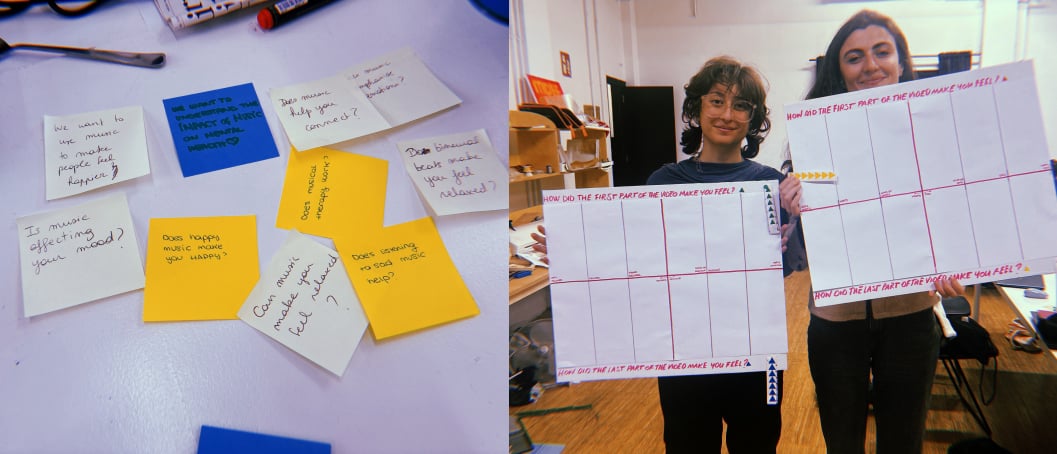
During this exercise, we had the option to choose tools relevant to our project theme: understanding the impact of music on emotions. We considered Arduino, a SmartCitizen Kit, physical intervention tools, and cameras. Although cameras seemed more challenging and interesting to capture people's reactions to music, we opted for a physical intervention which ended up being more adequate to collect qualitative data.

Our research experiment involved the creation of a series of videos that evoked certain emotions with a background music that matched the feeling of the visuals. However, halfway through each video, the music abruptly changed to a different feeling, and we observed the change in people’s moods.

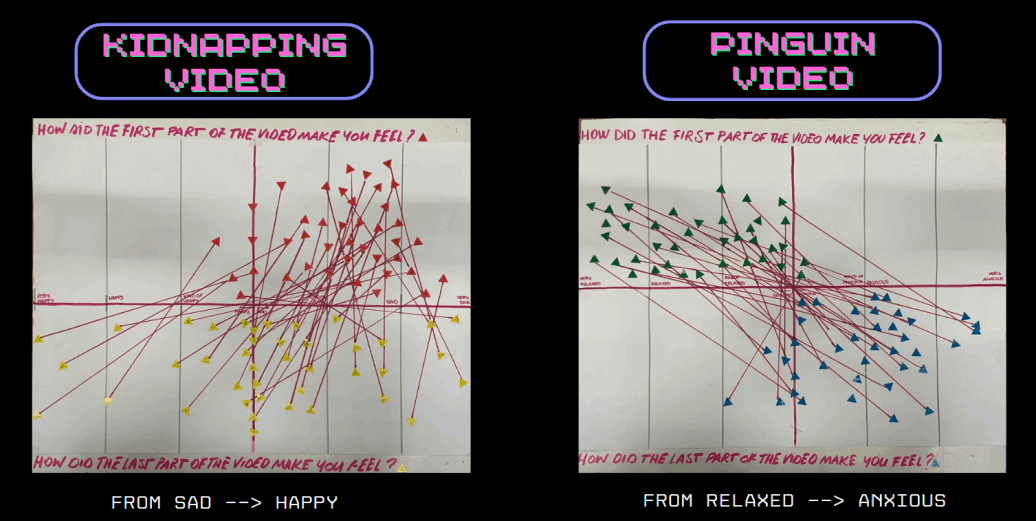
Kidnapping video: from sad to happy
Penguin video: from relaxed to anxious
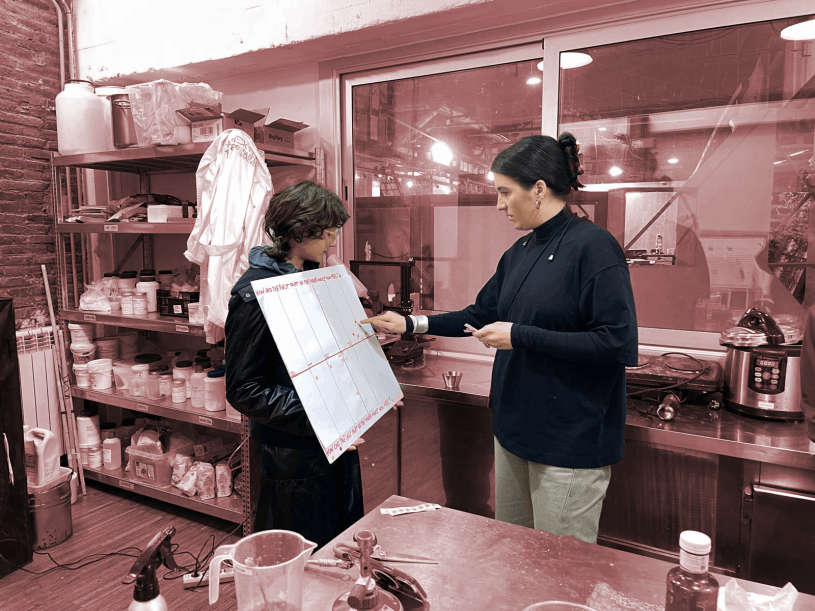
We then went on the streets and in the FabLab to ask people to complete the survey boards which we had created, asking to watch the videos and rank their emotions at the beginning and end of each videos.
Mobirise Website Builder

Results

Mobirise Website Builder

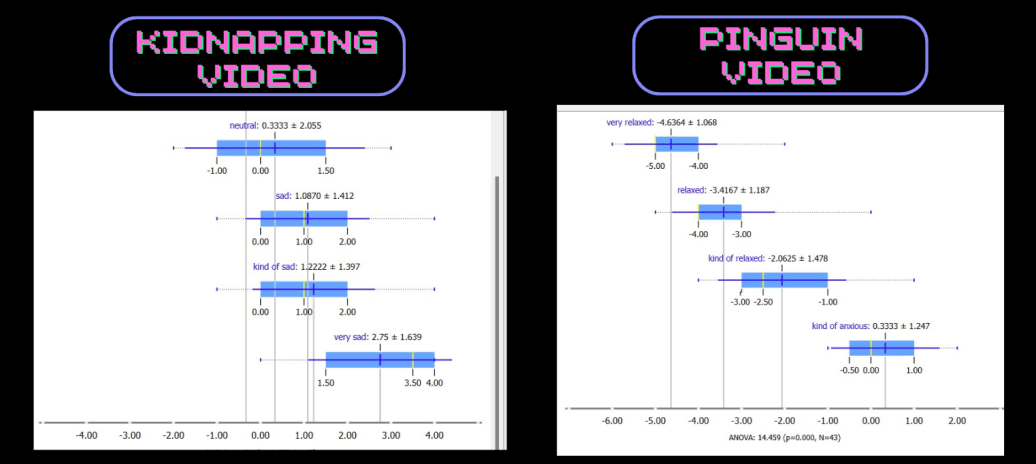
The graphs show that the variation of emotions in the penguin video was much clearer and uniform (from relaxed to anxious) than in the kidnapping video, where some participants went from sad to happy but others just remained sad.

Mobirise Website Builder

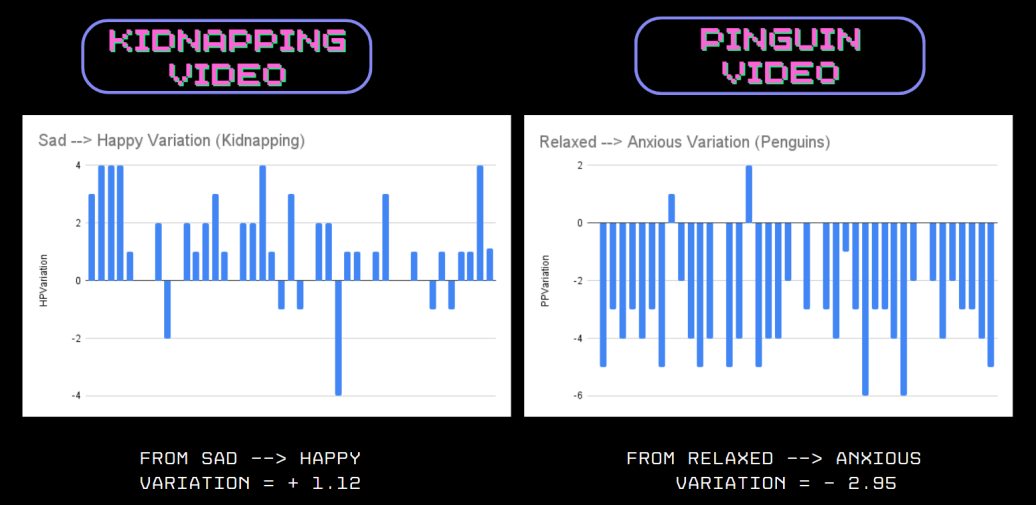
We turned the qualitative data gathered above in numerical data to be able to quantify and compare the variations of emotions. Those two graphs clearly show that variations are more intense in the pinguin video, with an average variation of -2.95, as opposed to +1.12 for the kidnapping video.

Mobirise Website Builder

These graphs show that for the kidnapping video, the sadder the initial emotion, the bigger the variation in emotion. In the penguin video, the less anxious the initial emotion, the smaller the variation in emotion.

Conclusions

We proved that music can alter people's emotions

Our hypothesis 0, that music cannot influence emotions was revoked. However, we proved correlation not causation. For the latter, a regression analysis would need to be done. There are also a variety of other variables that could have influenced the emotions of people in our interventions, which also should be taken into account when statistically examining the relationship between music and emotions.

The type of music influences the variation in emotions

We think that the lack of clear pattern in the emotion variation for the second part of the kidnapping video is because it was the only music that had lyrics and that was known by people. More neutral musics throughout the videos would have probably given clearer patterns.

People's background (mood, culture) influences the level of variation in emotions

We saw that the initial emotions were sadder, the variation in emotions were bigger, whereas when the initial emotions were more relaxed, the variation in emotions was smaller.

There might be bias due to the loss of surprise watching video 1 and then video 2

People knew what to expect when watching the second video, as the exercise was not a suprise anymore. This might have skewed the data collected.

Reflections

The seminar gave me valuable insights on the tangible and intangible nature of data, highlighting its dual existence in both the digital and physical realms, and how anything can basically become data. I was struck by the omnipresence of data collection, facilitated by satellites and digital platforms, and its implications on privacy and personal autonomy. However, as rightly pointed out by Oscar, this data only becomes meaningful when it is processed to become information to make sense of our world. And whether this information is manipulated with good or bad intentions adds another ethical dimension to data collection. 

Having chosen the physical interaction data collection method, as opposed to the other technology-oriented ones, I realised how useful these low-tech methods can be in capturing non-quantifiable and intangible things such as emotions and moods. Data collection with technology tends to process data in binary/numerical ways which have difficulties capturing nuances, which are inherent to human nature. However, this hands-on approach revealed the complexities of creating unbiased physical interventions and the challenges of interpreting data influenced by human dynamics.

Being very interested in making the imperceptible perceptible through data collection and visualisation, I hope to be able apply the key learnings of this seminar in my design practice, to help citizens make sense of themselves and the world around them beyond elements that we, as humans, are able to perceive.

AI Website Creator